The Module Screen
After you have created your first module, it is time to take a look at the Cyclops dashboard. The first thing we can see in the top left corner is the name of our module (demo), the namespace (cyclops) where the module inhabits in the cluster and the link that points towards the GitHub repository where the template is located.
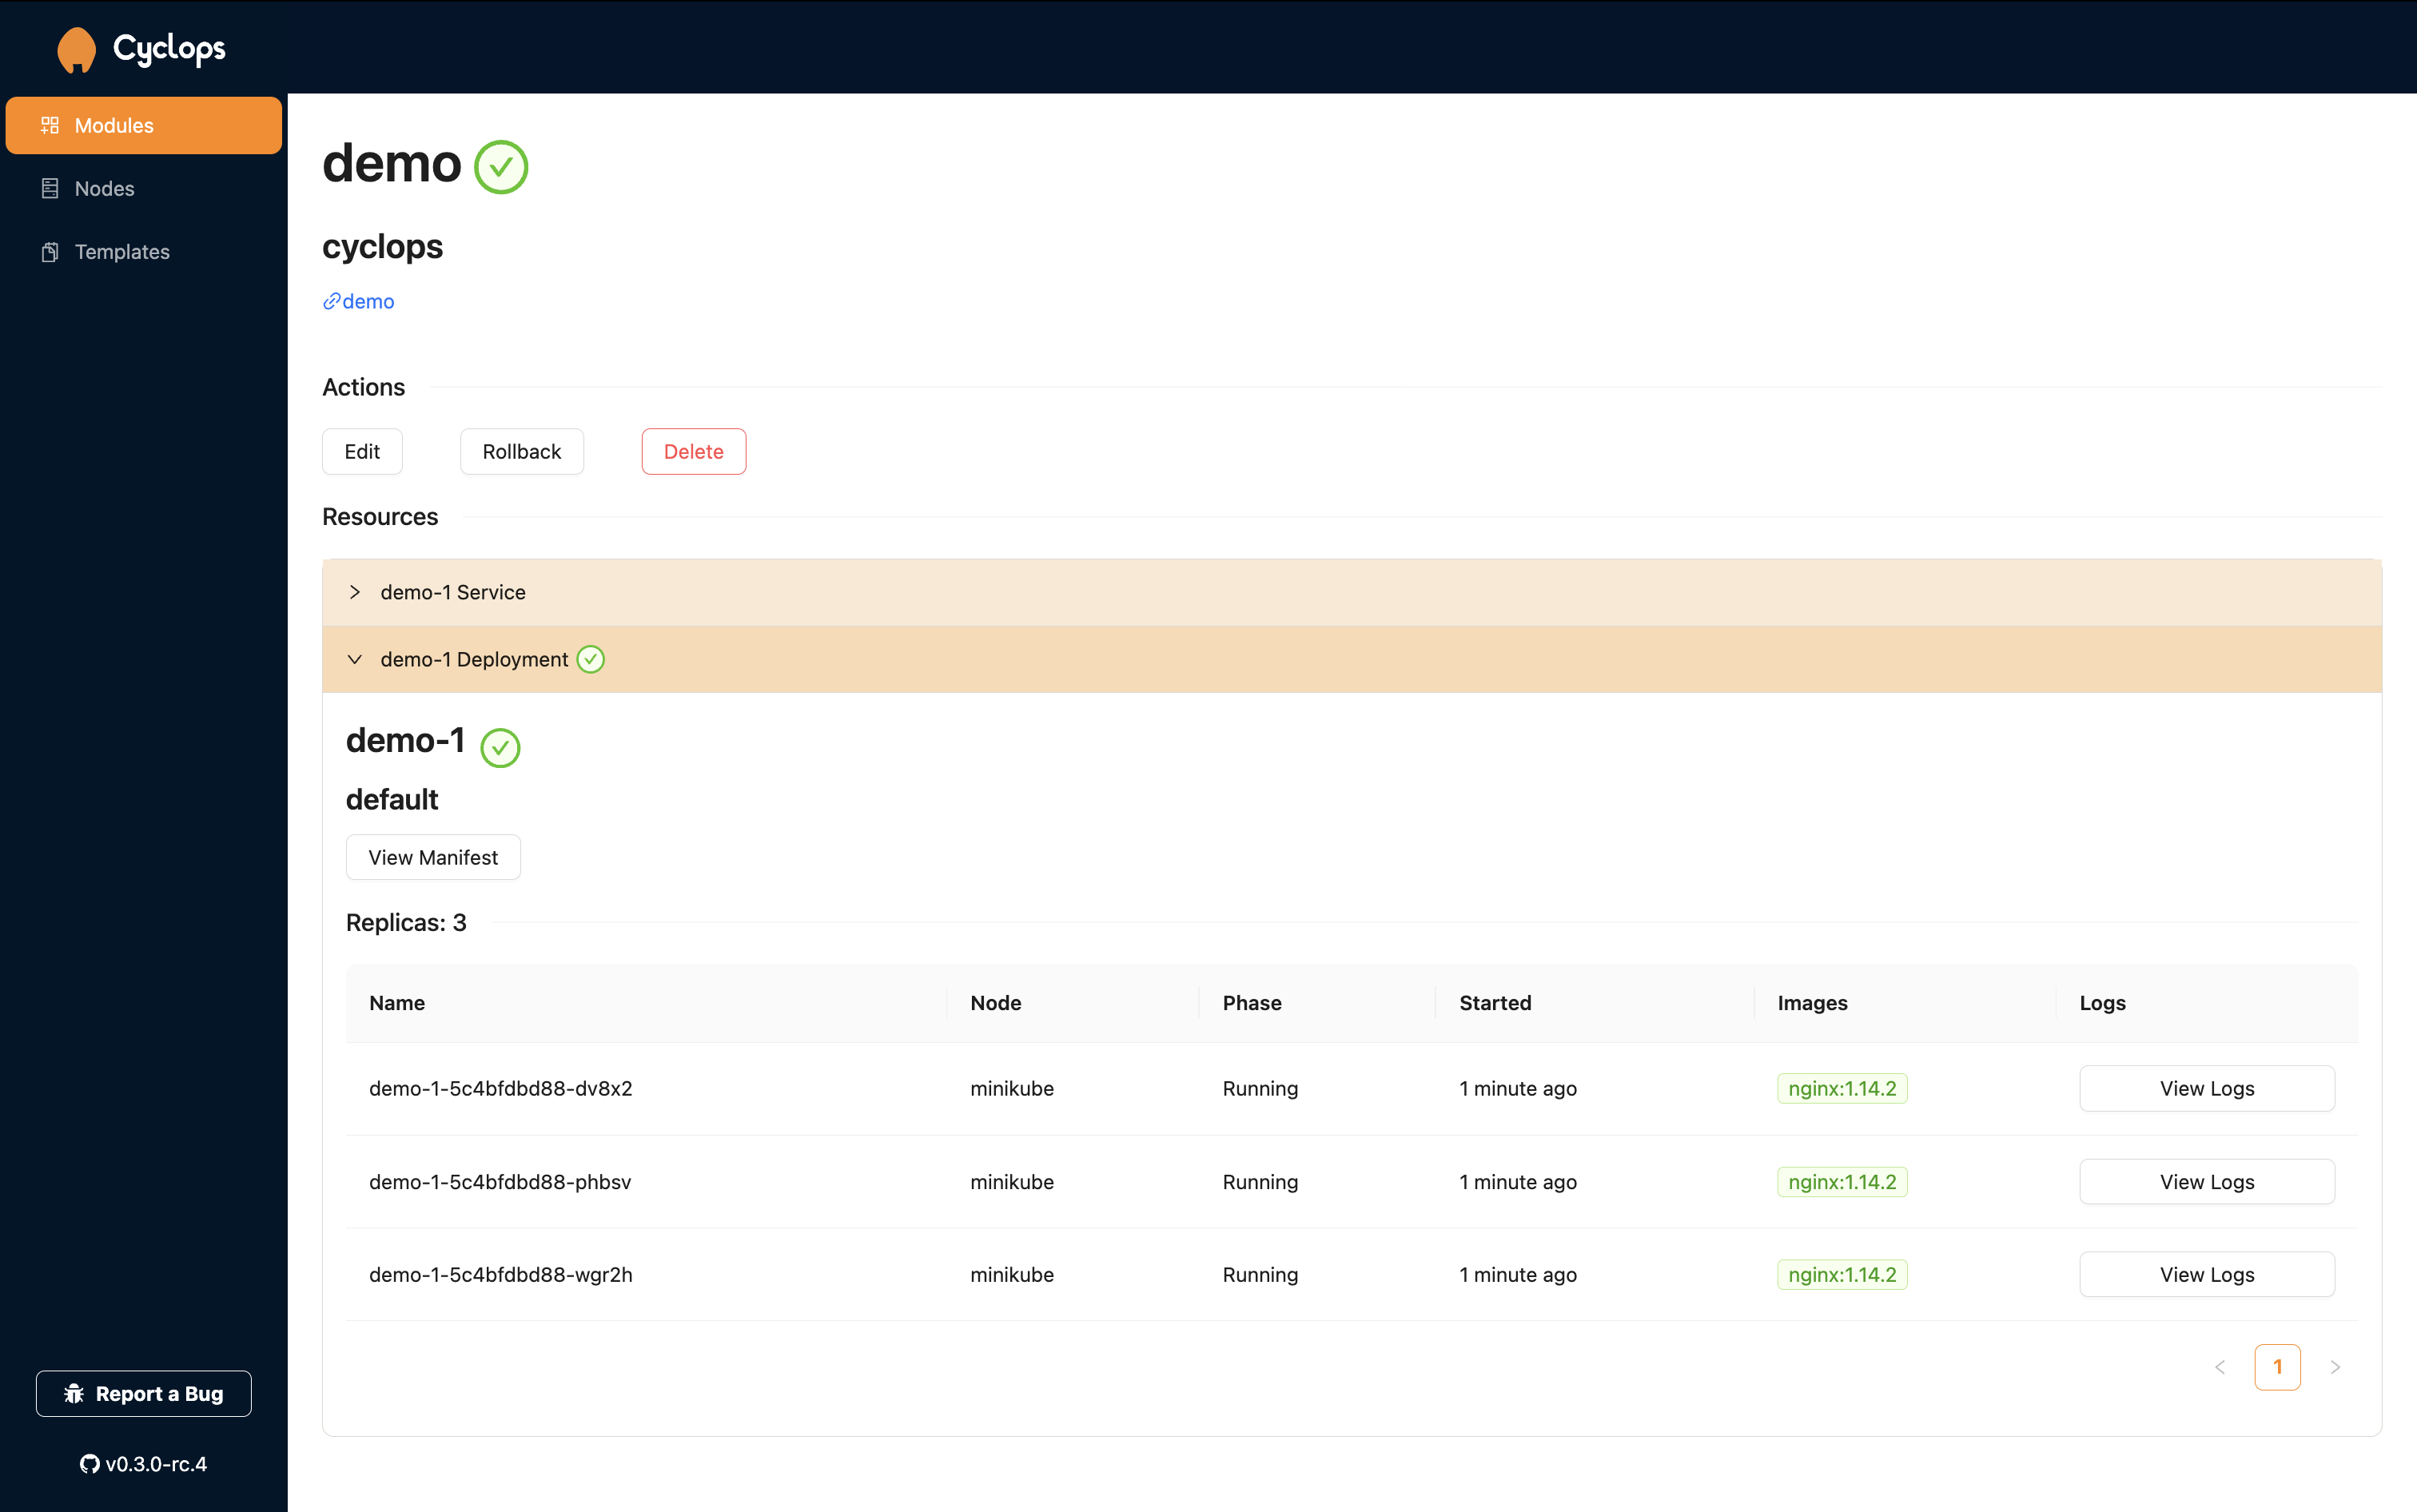
Actions
Here, we have listed the actions available for the current module.
Edit
The Edit button takes you to a new screen where you can edit the data we provided when creating the module. Let's leave it at that for now, and we will go more in-depth in the next chapter.
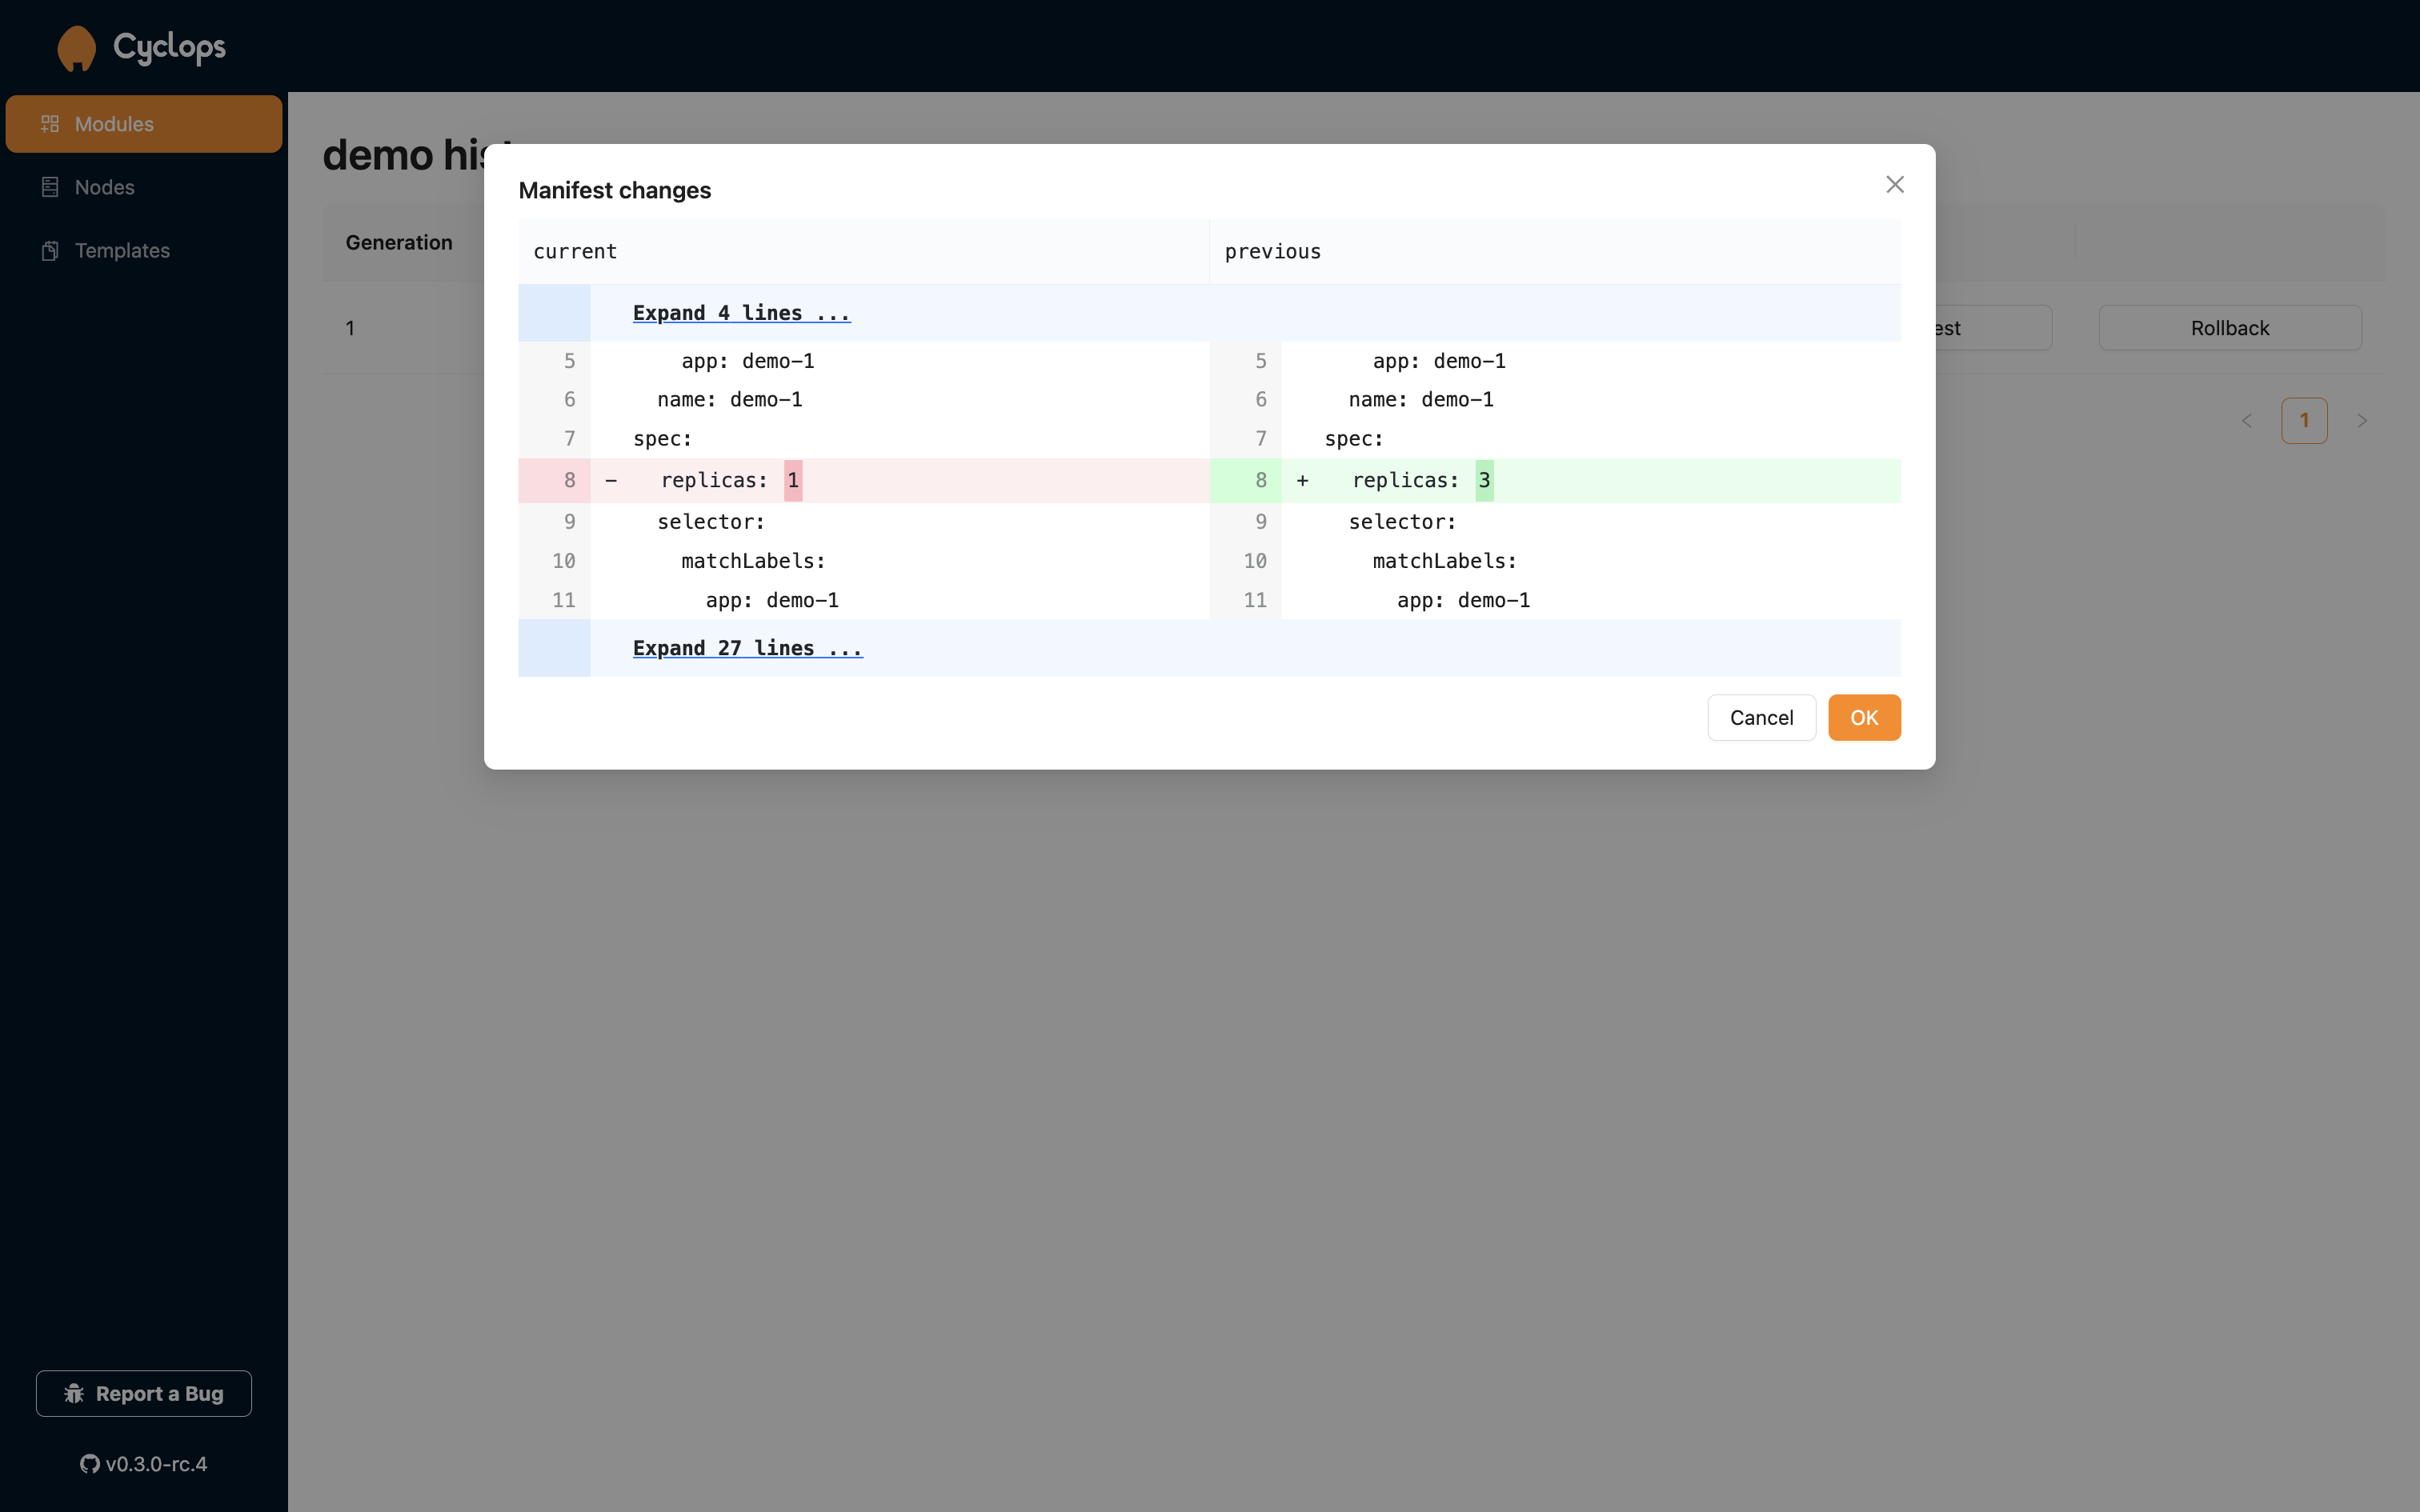
Rollback
The Rollback button lets you see the history of changes that you made to your module. Since we haven't made any changes, this screen should be empty.
However, every time you edit your module, you can find the trail of changes here. Manifest will show you how the previous version looked, and Rollback will show the difference between the current version and the version you want to roll back to. By clicking OK, your module will be reverted to the previous state.
Delete
The Delete button lets you delete the current module. When clicked, a popup window will appear, showing all the resources you are about to delete. If you wish to proceed with deleting your module, you are required to write the module name in the box. If correctly written, the delete button will turn red and can be clicked.
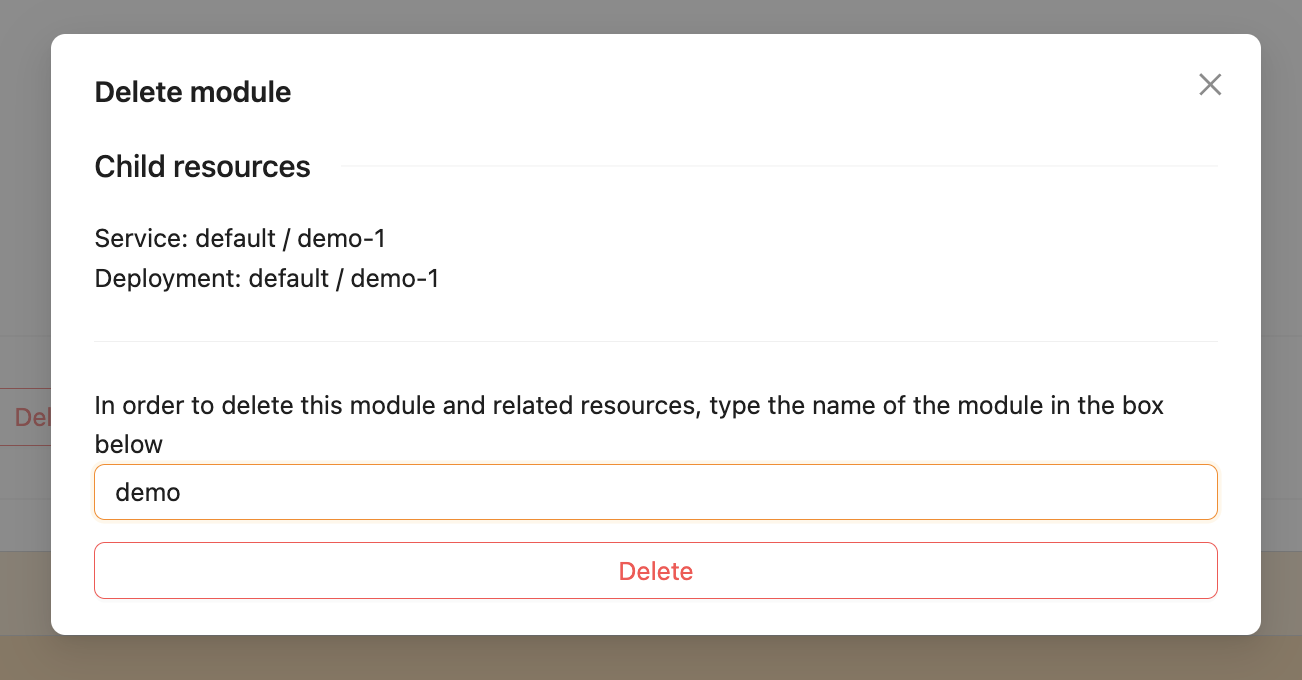
This action deletes the module and all its associated resources from the cluster!
Resources
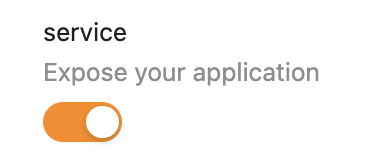
The module's resources are displayed here. These resources include Deployments and/or Services (other resources are still in development!). The Services tab is only visible when toggled in the configuration.
Deployment
Here are your deployments. Depending on the number of replicas you wanted, there should be an equal amount of pods.
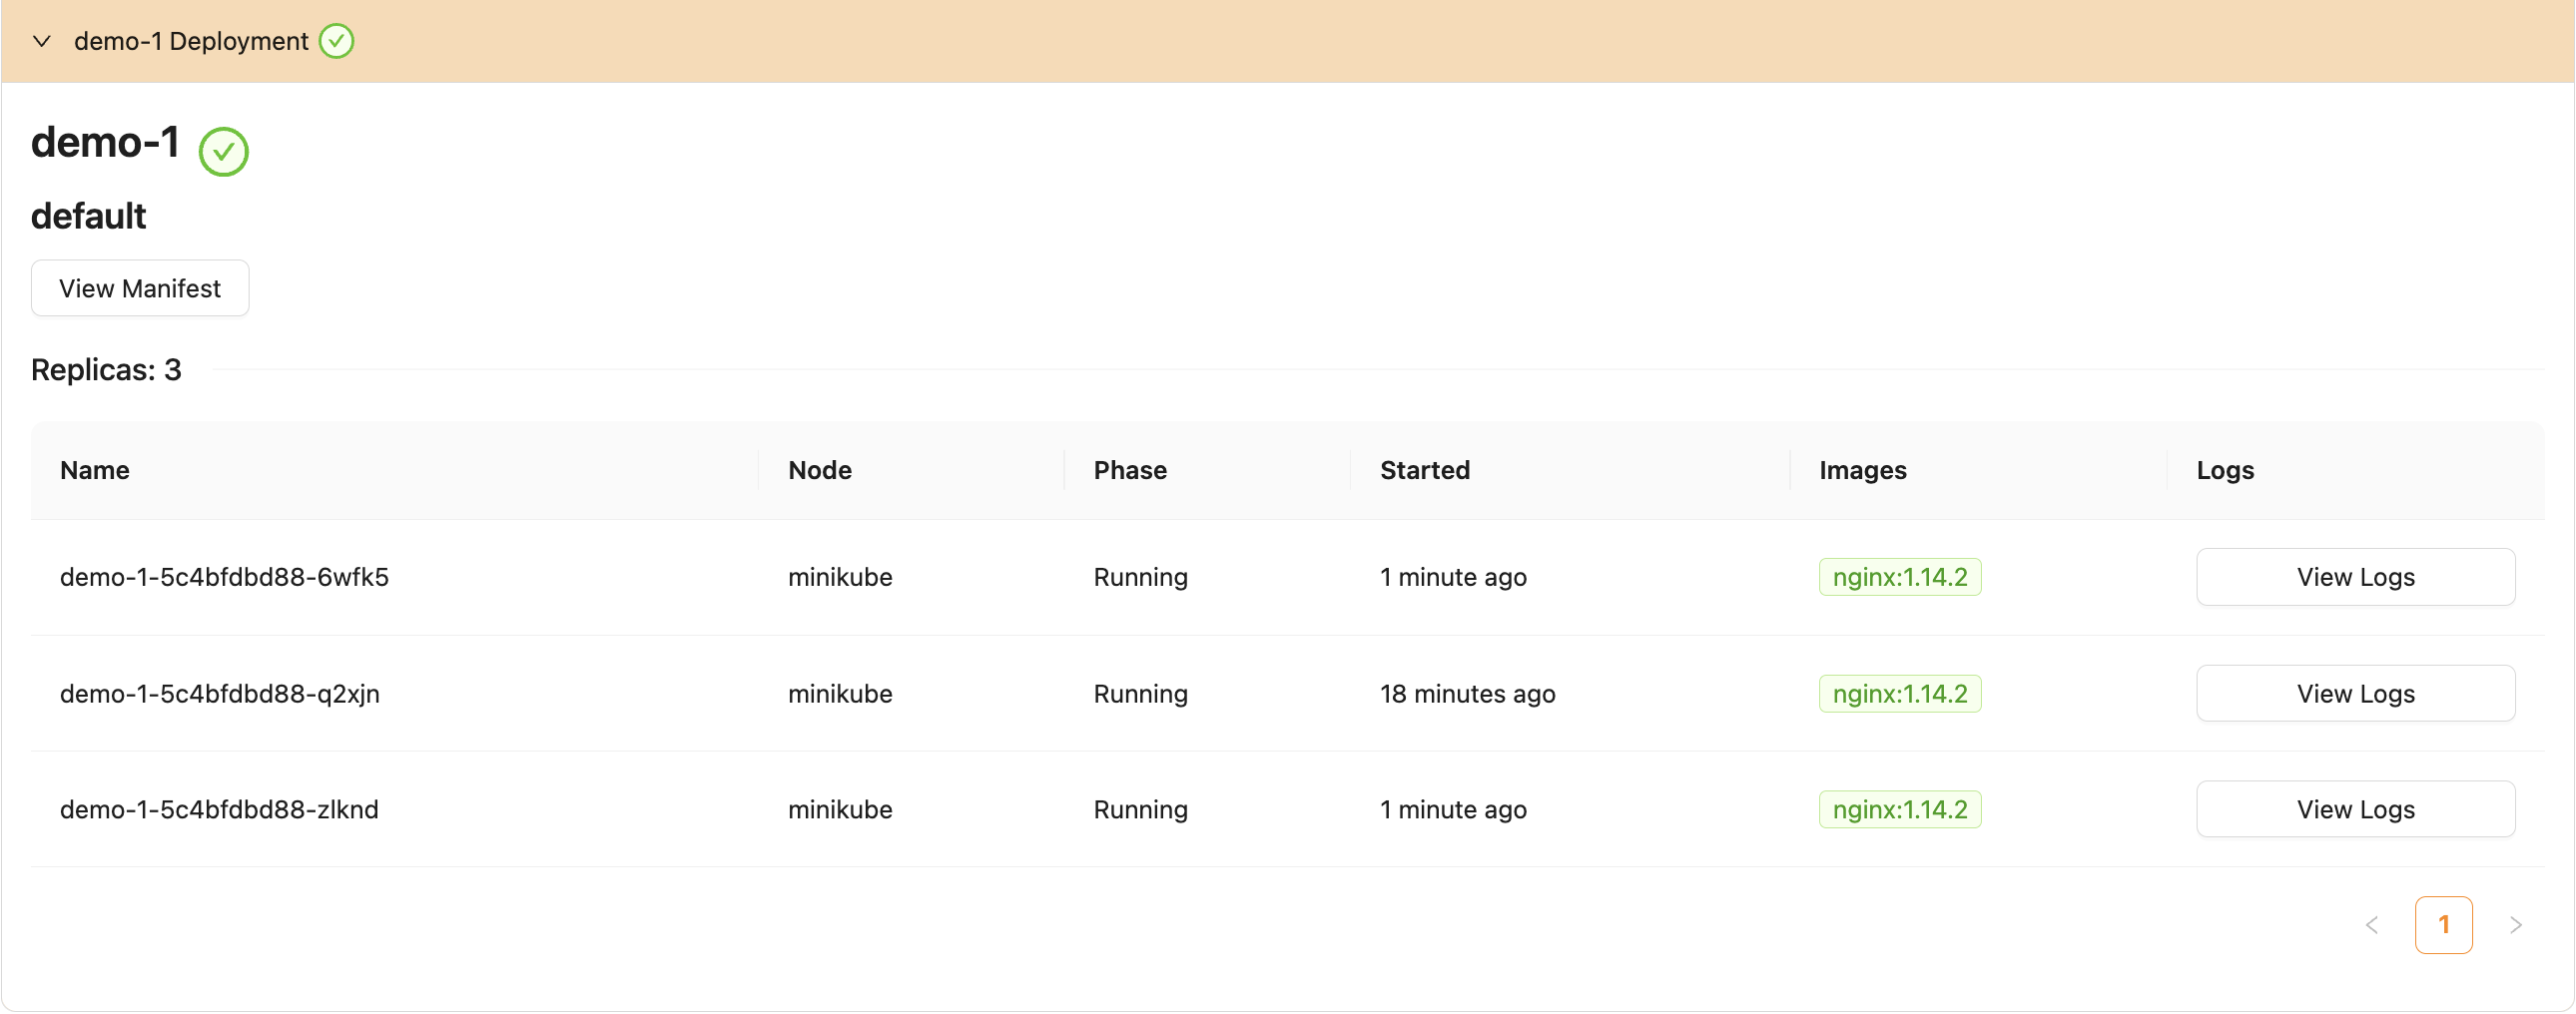
The topmost element we can see is the deployment's name, which in our case is demo-1. Right under, we can see the namespace where our deployment is located. In the current version of Cyclops, all of your deployments and services are put in the default namespace. Right under the namespace stands a button View Manifest. This button creates a popup that allows you to see the configuration file Cyclops created after you filled in the values for the template.
The Pods are displayed one under another. You can see their name, node, phase, lifetime, image and logs. View Logs is another popup window that displays the last 100 logs of the pod. If you are still interested in the logs feature, learn more about it in the Logs tutorial. For now, let's provide a short explanation for of the columns in the Deployment section:
Nameshows the full name of the podNodeshows the node in which the pod is runningPhaseshows the pod's current phase. This can be Running, if it's up or Pending, if it's trying to start upStartedshows how long is the pod already running forImagesshows which Docker images the pod is usingLogsshows the last 100 logs for each of the pod's containers
Service
Here is your service. In Kubernetes, a Service exposes a network application running as one or more Pods in your cluster. Here, we can also see the name of our service, demo-1, the namespace it inhabits, default, and the manifest. Underneath it, it shows the service's port and where it is pointing (the port of the pods).